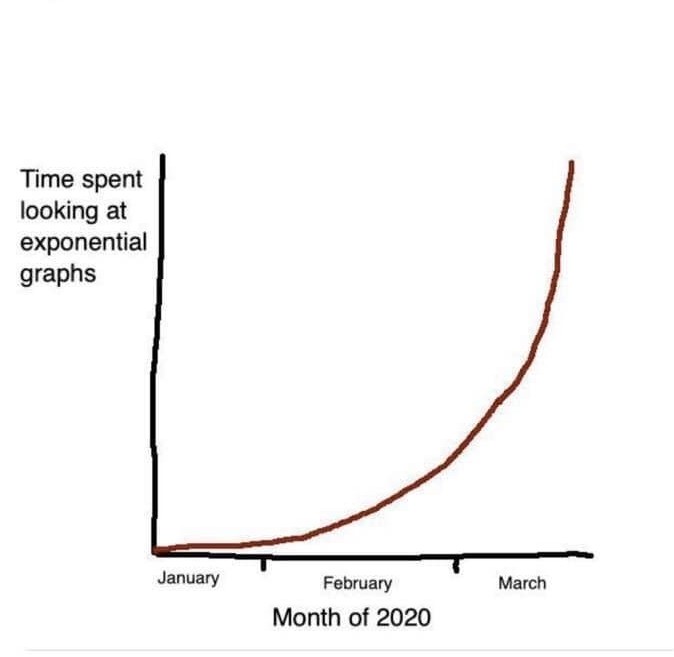
Note. The language and graphical representation of exponential growth (and decay) were not, until recently, present within public discourse. (Image Source: Tripathi, 2020; Posted to Twitter March 25, 2020)
Flattening the Facebook Curve: Exploring Intersections of Critical Mathematics Education With the Real, the Surreal, and the Virtual During a Global Pandemic
Annica Andersson, University of South-Eastern Norway
Kathleen Nolan, University of Regina
Authors’ Note
Professor Annica Andersson ORCID: https://orcid.org/0000-0003-1897-7322
Professor Kathleen Nolan ORCID: http://orcid.org/0000-0001-6587-6757
Correspondence regarding this article should be addressed to the authors: Annica Andersson contact email: annica.andersson@usn.no or Kathleen Nolan contact email: kathy.nolan@uregina.ca
Flattening the Facebook Curve: Exploring Intersections of Critical Mathematics Education With the Real, the Surreal, and the Virtual During a Global Pandemic
Figure 1
Time Spent Looking at Exponential Graphs

Note.
The language and graphical representation of exponential growth (and
decay) were not, until recently, present within public discourse.
(Image Source: Tripathi, 2020; Posted to Twitter March 25, 2020)
Research in mathematics education reports advantages of bringing real life problems into the mathematics classroom (Liljedahl et al. 2016; Verschaffel et al., 2000). This research includes important questions posed by critical mathematics educators of what and whose real life is actually being represented in these problems (Andersson & Ravn, 2012; Skovsmose, 2001a; 2014). In any case, there is a widespread belief that students will better connect and engage with mathematics if teachers can relate the mathematics topic/curriculum, in some ways, to a student’s “real life.” At the same time, current studies show (Hidayatullah & Suprapti, 2020; Quinn, 2018) that students are excessively connected to their “virtual life”: Facebook, Twitter, Instagram, TikTok, Youtube and other forms of social media. It seems that, specifically in the time of the pandemic, life is less real than it is surreal; it is less real than it is virtual.
In this article, we explore the virtual life of Facebook near the beginning of the COVID-19 outbreak, at the time when the world was in a state of shock, or bewilderment, about what was actually happening. It was two weeks after the famous March 2020 speech by Dr. Tedros Adhanom Ghebreyesus (WHO General Director) in which he declared the Corona virus a pandemic[1] when we started to notice an increasing number of graphs, diagrams, images and mathematical models relating to the pandemic on our respective Facebook walls. We were drawn to consider what it might look like to apply a critical lens to the mathematical world of Facebook at this specific point in time. For the purposes of this paper, we selected a number of these Facebook posts to discuss and analyse through questions based in critical mathematics education research. We first identify the mathematics topic/concept being depicted through the image and, second, how that Facebook post might serve as an artefact of critical mathematics education. Our analyses draw attention to public discourse(s) around mathematics, as well as how numbers, graphs, diagrams, and images are used on Facebook.
Research Design and Methods
To initiate our research process, we collected a large number (more than twenty-five each) of mathematics-focused images, graphs, and/or diagrams (for simplicity, we use the term “images” from this point forward) appearing on one or the other each of our Facebook pages, during a 1-week period (March 26–April 1, 2020), a week of heightened news with regard to the global spread of COVID-19. Through a collaborative approach of carefully examining and discussing this collection of images, we made decisions around keeping a smaller number to focus on for our analysis. These decisions were informed by recognizing that several of our images depicted similar mathematics concepts, representations, and/or grade levels which we felt could lead to redundancy in our analysis. In addition to our effort to avoid redundancy with respect to the mathematics depicted in the image, our selection was also guided by our desire to draw on diverse questions from our chosen framework for analysis. In the end, we selected 12 images for our analysis, ranging from exponential graphs of infection rates and pie charts of online attention spans to a mathematical infatuation with cats and geodesic domes. Due to the nature of Facebook—and the ease with which one can share, re-share, and re-post content—it is not a simple task to trace an image back to its “original” source. As noted by Benoit (2018) in his study of mathematical Internet memes: “With the click of a button, a meme can be disseminated to millions in seconds” (p. 2). For this reason, it could even be proposed that such images rapidly become part of public domain. For the purposes of providing some detail on context and authorship, however, we have provided a Facebook posting date, along with the name and URL of a source for each image. We assure the reader that, in spite of providing only minimal details on the image creator/author, our intention is not to present a decontextualized analysis of the images; on the contrary, we feel confident that we adequately position these images within a period of time when the world found itself within the first month of institutional lockdowns, restricted movement and limited (often inaccurate) knowledge on the specifics of transmission.
In this paper, we view and analyse our 12 selected images through two lenses: first, we ask what mathematics topic/concept is being depicted through the image and, second, how might that Facebook news item (in some cases, posted with serious intentions and, at other times, likely posted to lighten the mood and disposition of the reader) serve as an artefact of critical mathematics education for school learners. For the second lens, we draw on a framework of questions which we developed by drawing on key critical mathematics education (CME) scholars. In doing so, we claim that our work begins with the virtual (mathematical world) and the surreal (what is often coined “the new normal”) as a way of connecting to the real (mathematics classroom).
As noted, our intention in this paper is to construct an analysis of Facebook posts through a lens of questions based in critical mathematics education. While the field of critical mathematics education offers many possible directions and perspectives, the questions we formulated for our analysis draw on four main sources: Skovsmose (1994), Andersson and Wagner (2017), Barwell and Abtahi (2019), and Nasir et al. (2008). Our analysis is limited to the 12 selected posts, although we believe that we model a process which could be adopted and adapted by mathematics teachers and teacher educators in their own practices and specific contexts. We realize that the virtual “remote teaching” reality that is presently (as we write this) being imposed upon many teachers due to the pandemic is temporary (or at least we are hopeful that this is the case); however, the process we model will be a valuable addition to any teacher’s repertoire of critical approaches that can be drawn upon, in both virtual and real mathematics classrooms.
Literature Review
In our aim to apply a critical mathematics education lens to public discourse(s) around the mathematics of Facebook posts, we review research literature in three key areas: Real-world mathematics, critical mathematics education, and Facebook as a research context.
Real-World Mathematics
With respect to what is meant by a real-world problem, Jurdak (2006) offered that it “refers to the actual experience of a real-world situation which calls for the person to make a decision based on whatever tools (including mathematical) are available and accessible to the person” (p. 285). Often interchangeably referred to as real world, real life, context-based and/or situated, the real-world problem is used “to refer to any mathematics problem that makes use of a real-world context” (le Roux, 2008, p. 308). Some researchers account for efforts where societal, environmental or other problems become connected to the required mathematics. These problems might even be chosen by the students themselves (Andersson, 2011; Andersson et al., 2015). Hence, instead of searching for real-world contexts with mathematical topics (which usually becomes a semi-reality (Skovsmose, 2001a), these researchers suggested turning the process around and searching for the mathematics needed to discuss the real-world’s specific challenges. In this vein, Steffensen et al. (2018) showed how “wicked problems” became a basis for addressing climate change in a Norwegian context. Similarly, Lunney Borden (2021, forthcoming) challenged mathematics teachings in Indigenous communities where real-world projects tend to focus on Indigenous artefacts, and instead she suggested investigating topics such as the rates of diabetes in Indigenous communities, the ongoing problems of unsafe community drinking water and other social justice issues. Hauge and Barwell (2021, forthcoming) addressed “post-normal” dilemmas (see Funtowicz & Ravetz, 1993) which, in contrast to mathematical school problems, have three important features: “a high level of conflict, a high level of uncertainty, and a high level of urgent risks.” The COVID-19 pandemic is a clear example of a “post-normal” problem. Skovsmose (1994) reminded us, however, that these problems are solved, or at least explained, with mathematical models that are usually un-questioned or un-critiqued. We note that those mathematical models explain the pandemic, covered with diagrams and graphs, that these days we see—or rather wade in—in the news, in the media, and on Facebook.
Critical Mathematics Education
Mathematics intervenes in reality by creating a “second nature” around us, by giving not only descriptions of phenomena, but also by giving models for changed behaviour. We not only “see” according to mathematics, we also “do” according to mathematics. (Skovsmose, 1994, p. 55)
During the pandemic, we have become surrounded by experts using mathematics for modelling and predicting the virus spread, numbers of deaths, patients requiring intensive care and, in addition, all the complex economic problems arising in the backwaters of the pandemic. These experts, building their public advice and underplaying political decisions, are shaping our behaviours and actions during the pandemic and even influence how we interact in our closest relationships. How we can (not) move in space, who we do (not) meet, how we act, react and interrelate during the pandemic is clearly formatted with mathematics, mathematical modelling, and technology. These days, maybe clearer than ever, we see, accept, and acknowledge that mathematics shapes our reality.
Skovsmose (1994) explained how the process works when mathematics shifts from being descriptive to becoming prescriptive. He offered: “We not only ‘see’ according to mathematics, we also ‘do’ according to mathematics” (Skovsmose, 1994, p. 55) and hence society becomes formatted through mathematics. The idea of societal formatting becomes, during the pandemic, intrinsically obvious in how we (not) act in (real) reality but furthermore become more engaged in the “virtual” reality. Hence, the use of mathematics and mathematical models have real social effects: our lives, and now also our deaths, are (and becoming even more so) organised by mathematics. Mathematics, particularly in the process of modelling, is thus used to describe different aspects of reality in virtuality. Descriptions now become prescriptions, dictating how we should behave to stay safe and healthy. Consequently, mathematics becomes, in Skovsmose’ (2001b) language, a realised abstraction in our social (real) and virtual reality. In this paper, we specifically focus on the virtual formatting in order to uncover different ways that mathematics shapes our present pandemic experiences and behaviours. We argue that during and after the pandemic there is an important role for critical mathematics education to play in conducting analyses of societal and media information.
We define critical mathematics education (CME) in the words of Skovsmose (2000) “as an expression of some broader concerns about mathematics education” (p. 2), including “attempts to consider mathematics in its social, cultural and political complexities” (p. 7). An underlying characteristic of CME is expressed by Andersson and Wagner (2017) as “the apparent objectivity of numbers in the way they are usually represented gives users of mathematics the power to claim objectivity and to render contentious ideas as inevitable and incontrovertible” (p. 24). Mathematics education should address the role of mathematics in society, and we argue that mathematics education can also critically address the way mathematics and mathematical modelling shapes our knowledge (fake or not) and behaviours (good or bad) during the COVID-19 pandemic.
Facebook as a Research Context
As a form of Internet-based social media platform and networking, Facebook enables anyone (over a certain age) to register for an account, create a personal profile, and become part of a network of “friends” who circulate (post and share) texts, photos, videos, and so forth, among themselves and, potentially, other users worldwide, depending on selected privacy settings. These posts of texts, photos, and videos, also referred to by some as memes, appear on Facebook walls and serve “as a vehicle, carrying ideas, practices, culture, and/or symbols from person to person in various forms” (Benoit, 2018, p. 1). Benoit (2018) suggested that the production and consumption of memes on social media by the general population “has transformed them into popular culture” (p. 1) and, in a manner similar to what we aim to achieve in this paper, Benoit (2018), in his research, sought to understand how mathematics is portrayed in memes across many platforms of social media (Facebook, YouTube, Instagram, etc.).
Looking reflexively at our personal Facebook walls, we note that we both are middle class female academics and teacher educators in the privileged Western world (Kathleen identifies as Canadian, Annica as Swedish), and our walls, for the most part, mirror those of our friends and the groups we follow that connect to our working life. In addition, we obviously have interests outside of our academic life; Annica has a high number of outdoors, hiking and pilgrim friends and Kathleen is connected to volunteer organizations and animal rescue contexts. Besides, younger family members share a number of posts, and we note that two of the chosen images were shared by a 24-year-old student.
As noted previously, attempts to solve, or at least explain, the complex problem of the pandemic makes use of mathematical models, and these models are what we see and wade through in the news, in the media, and on Facebook. Facebook as a context for achieving wide distribution of these “real world” models makes perfect sense if one believes reports on the numbers of Facebook users. For example, in the digital marketing world, Noyes (2020) reported that, as of March 31, 2020, “there are over 2.6 billion monthly active users” worldwide on Facebook. In the month of March 2020 alone (our data collection month), more than 1.7 billion people logged onto Facebook daily and were thus considered daily active users (Noyes, 2020). Though Facebook may be seen as a desirable site for marketing and advertising, it is not these interests alone that account for so many Facebook users. In the realm of education, and mathematics education specifically, some have argued that Facebook and other forms of social and participatory media can increase community engagement (Chen, 2017) and also help “students link mathematics to their daily activities, inside and outside the school” (Casey, 2013, p. 62). Similarly, Quinn (2018) offered a number of student activities which explicitly study the mathematics of social media, including drawing on graph theory to understand the networks involved in the virtual world of Facebook friends.
Critical Mathematics Education (CME) Analysis
As introduced earlier, for our CME analysis we present here a set of questions adapted from four key sources: Skovsmose (1994); Andersson and Wagner (2017); Barwell and Abtahi (2019); and Nasir et al (2008). Skovsmose (1994) invited readers to understand critical mathematics education as a critical “approach to” or rather addresses critical “concerns about” relations between mathematics and mathematics education on the one hand, and the power of the use of mathematics in society and subsequent formatting of society, based on values of democracy, social justice and freedom on the other hand (Gutstein, 2006; Skovsmose, 1994; Valero, 2004).
Andersson and Wagner (2017) invited readers to consider how numbers are presented in mathematical and political arguments. They explored how numbers were (not) used in the context of analysing the Canadian Truth and Reconciliation Commission reports (TRC, 2015). They claimed that “it is necessary for mathematics educators to help their students understand how numbers can be used politically and how numbers can be positioned in such contexts” (p. 19). In grappling with the culturally situated use of number, Andersson and Wagner (2017) were careful “to underline that caution needs to be taken with respect for cultures, people, and spaces when working critically (and mathematically) with ethically rich documents” (p. 32). They formulated a set of questions—such as where are the numbers, where are they not, and why might the author have chosen this representation—and they encouraged mathematics teachers and teacher educators to raise these questions with students when mathematically investigating ethically and culturally rich documents. For the purposes of this paper, we find their questions valuable to use when analysing the Facebook entries about COVID-19, since numbers are (not) used politically and/or positioned in vulnerable contexts even if masked in fun diagrams, hidden in colourful graphs or presented in a humorous context.
In relation to media practices and mathematics content, Barwell and Abtahi (2019) posed broad and critical “questions about the treatment of mathematics education in news media and the role of mathematics education in interpreting media reporting” (p. 1). Although the authors found it “surprising that little research has been conducted on the nature of news media discourses of mathematics education” (p. 2), they claimed that media coverage tends to oversimplify the complexity of teaching and learning mathematics, seemingly reducing these endeavours to naïve, dichotomous discourses such as ‘back to basics’ vs. ‘discovery learning’” (p. 2). Their critical questions included the following: “What discourses are apparent in news coverage about mathematics education? How does the medium shape the message? How do consumers of news media interpret these discourses? How do these discourses construct mathematics education, mathematics curriculum, teachers, students, and so forth? How are prevailing discourses linked to broader political ideologies?” (p. 1). These questions guided our analysis, helping us to focus some attention on medial discourses about mathematics and mathematics education.
The fourth source we draw on is Nasir et al. (2008), who interrogated the (perceived) boundaries between cultural and domain knowledge in mathematics. These authors “explore[d] relations between ‘everyday’ informal math knowledge and school math as a way to enter the conversation about the cultural nature of mathematics” (p. 191). In their work with youth in non-school settings, they found that “out-of-school environments hold quite different opportunities for youth in terms of authentic problem solving, ongoing feedback, and meaningful relationships” (p. 191). Nasir et al. (2008) maintained, however, that as long as “mathematics holds a privileged status in our society as an elite activity for the smartest of citizens” (p. 226), then the importance of everyday problem contexts and students’ own realities will continue to be rejected as mathematical knowledge.
In the following table, we summarize the critical questions and their corresponding sources that we draw on for our analysis:
Table 1
A Summary of the Critical Questions Drawn on for Analysis (With Sources)
CME Questions |
Adapted from source |
· How does the mathematics of this image serve as a tool for identifying and analysing critical features of society, either globally or locally? · In what ways does the mathematics of this image reproduce inequalities? · Is the mathematics itself of this image problematic because of the function of mathematics (that is, where the mathematics itself is both a tool for, and an object of, critique)? |
Skovsmose (1994) |
· Number analysis: Where are the numbers? Where are they not? How are the numbers represented? Are they specific or vague? Are they rounded? Are they absolute numbers or proportions? If they are proportions, what is being compared? · Image (other representation) analysis: How are graphs/diagrams/images used? Or not? · Why do you think the authors chose to use numbers, graphs, images, or other forms of representation as they have done? What do their choices prompt readers see and not see? · What if not? Consider different ways of reporting on the same phenomena. What would be the effects of these different representations? (This may require investigative research to find missing data.) |
Andersson and Wagner (2017) |
· What discourses are apparent in this image about mathematics education? · How does the medium shape the message? How do “consumers’” of this image interpret (or are expected to interpret) these discourses? · How do these discourses construct mathematics education, mathematics curriculum, teachers, students and so on? How are prevailing discourses linked to broader political ideologies? |
Barwell and Abtahi (2019) |
· In what ways does the image reflect “out-of-school environments [which] hold quite different opportunities for [the reader] in terms of authentic problem solving, ongoing feedback, and meaningful relationships”? In what ways does the image potentially allow for the reader to demonstrate “rich mathematical problem-solving strategies in non-school contexts”? (p. 191). · In what ways does the image potentially “problematize [and/or nurture/perpetuate] Eurocentric assumptions about valid mathematics and the power issues at play in deciding whose mathematics to legitimize”? (p. 195) |
Nasir et al. (2008) |
Introducing the Images
We analysed images that were posted on one or both of our Facebook walls during the time period of March 26–April 1, 2020 with a focus on posts with mathematical content in its widest sense. We looked for graphs, statistics, texts with or without numbers, images and diagrams presenting mathematical arguments, and so forth—all of which referred to different aspects of the COVID-19 pandemic. In other words, all chosen images connect, in some way, to mathematics content with/in society during an early period of the COVID-19 pandemic. We build the analysis section by presenting critical mathematical conversations where, in an interpretative way, we account for our reflections on the mathematical content and critical mathematical education possibilities, as well as implications for pedagogical content. We note that, since the mathematical level varies, the images may serve as inspiration for teaching in the different school levels—from kindergarten to university and teacher education.
Country Comparison Images
We begin with two images (see Figure 2 and Figure 3), both of which function to draw the reader/student into the familiar anticipation of number-based graphical analyses. The first one depicts the number of COVID-19 cases to March 25, for seven selected countries, while the second image illustrates the total number of reported cases through the presentation of six bar graphs.
Figure 2
A Depiction of the Number of COVID-19 Cases to March 25
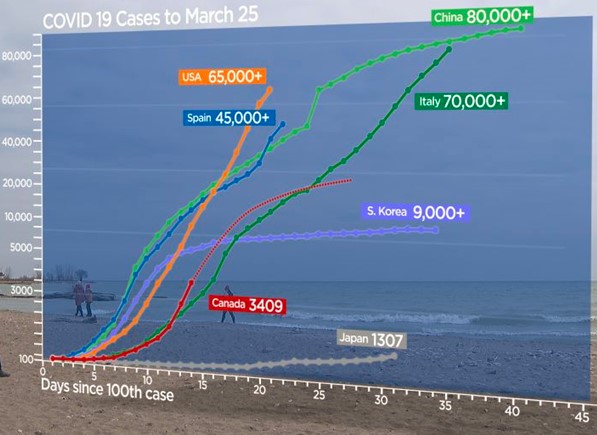
Note. This image is an example of the kind of statistics and diagrams that leave readers with feelings of uncertainty rather than actual or factual information. (Image Source: Global News Canada, 2020; Posted on Facebook March 26, 2020)
Critical Mathematics Conversation
The first image (Figure 2) we analyse contrasts the numbers of COVID-19 cases over time after the 100th case was established in the (specifically chosen) countries. This image is a “school example” of the kind of statistics and diagrams that leave readers with feelings of uncertainty rather than actual or factual information about both the mathematical content and the societal content—that is if you become inspired to stop and reflect about what is actually going on within this image.
The image provokes us, and hopefully secondary school students, to raise mathematically grounded questions in the vein suggested by Skovsmose (1994), for example, about the bizarre scales on the x- and y-axes. The unit distances expand along the horizontal axis and skips in inconsistent ways on the vertical axes (after having started at the number 100) with the first and largest skip being a “unit” of 3,000 infected, while the last and shortest skip is a unit of 20,000 infected individuals. Some countries’ numbers are rounded off to the closest 10,000 (for example China); others to the closest 1,000 (South Korea) while two countries’ numbers are reporting the exact numbers of infected individuals (Canada and Japan). In addition, we could ask what the “+” after the rounded numbers indicates, and how the slopes (positive and negative slopes have specific meanings in terms of infection rates) can be interpreted.
The background of the photographical image suggests feelings of isolation and hence, maybe feelings of security to not get infected, with people walking (safely) with a required physical distance on an almost empty beach. During the heavy global lockdown period in early April 2020, several sources reported that more than 60% of the global population were in lockdown, and could not go outside their living quarters, let alone stroll on a beach. This photographical image would thus only serve as a dream for the 3,6 billion people on earth who were not even allowed to go outdoors in those months. In addition, the blueness and the vast horizon in the background inspired us to reflect on eternity: What will the world look like after the pandemic? Will we (and/or our loved ones) even be around…? In contrast, the waves seem to roll in heavily but rhythmically, as they always do; waves and tides come and go, in a mathematically and physically expected rhythm, indicating that some things are still “normal” and predictable in an uncertain and surreal world.
Figure 3
Bar Graph Presentation of Total Number of Reported COVI0-19 Cases
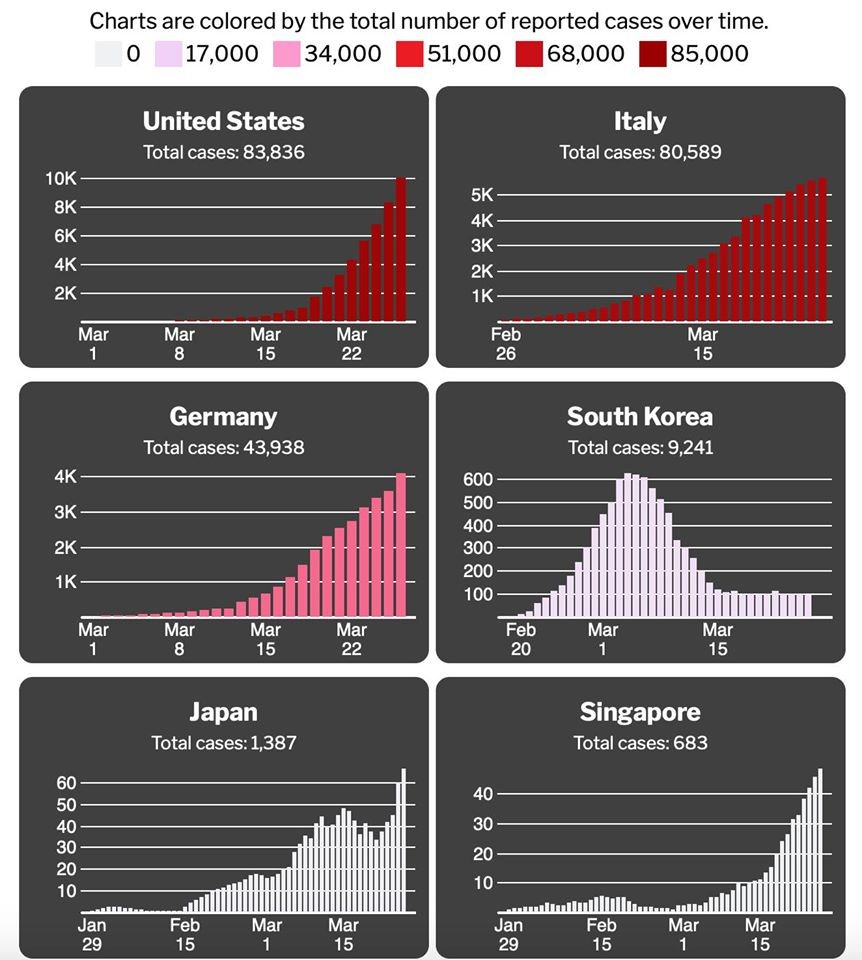
Note. The main mathematical problem with these bar graphs is that the graphs actually are not comparable as none of the graphs share the same units of scale. (Image Source: Wolfson & Wilson, 2020; Posted on Facebook March 26, 2020)
Critical Mathematics Conversation
The second image (Figure 3) of country comparison diagrams illustrates the numbers of reported cases in six countries. However, instead of showing the different countries in the same diagram, which was most common on our Facebook walls, here each country got their own individual bar graph, side by side. The main mathematical problem with these bar graphs is that the graphs actually are not comparable. What is indicated by a first quick glance might not be the case, as none of the graphs share the same units of scale. In other words, if we only look at the image, without tracing the explained colour codes or noting the total case numbers, the different unit distances on the vertical axis make us believe it is Singapore who has the highest number of reported cases because Singapore’s bars are highest. However, on closer look, Singapore actually has the lowest number of reported cases. Inspired by Andersson and Wagner (2017), we realize that the choices made by the people behind the bar graph tricks our eyes and might fool us as readers if we are not observant on details. The different scale units on the horizontal axis disrupt the slopes in the same vein and hence also make them un-comparable. We believe that rich critical mathematics conversations (Skovsmose, 1994) will develop in any classroom if questions such as “Which of these six countries had the fastest increase in numbers of reported cases?” were posed; the answer is not obvious at either a first or a second glance.
The societal CME questions asked of both comparison images may inspire us to talk about, and work further with, mathematical arguments as suggested by Andersson and Wagner (2017), to discuss difficult questions in class. Why were these countries chosen and not others? Who are in(ex)cluded and what might be the reasons for these choices? Why are only countries from the Northern hemisphere represented, and hence, how is this mathematical tool used to further stigmatization of global differences and media discourses (Barwell & Abtahi, 2019) in a North/South perspective? (see le Roux, 2019). Are there (hidden) media discourses about countries in the Southern hemisphere which might make certain countries invisible? Following Nasir et al. (2008), Eurocentric values seem confirmed but, even more important, how can they be problematized when reflecting on these two bar graphs?
The New “Virtual Reality” Image
Figure 4
Diagram of Zoom Meeting Attention Span
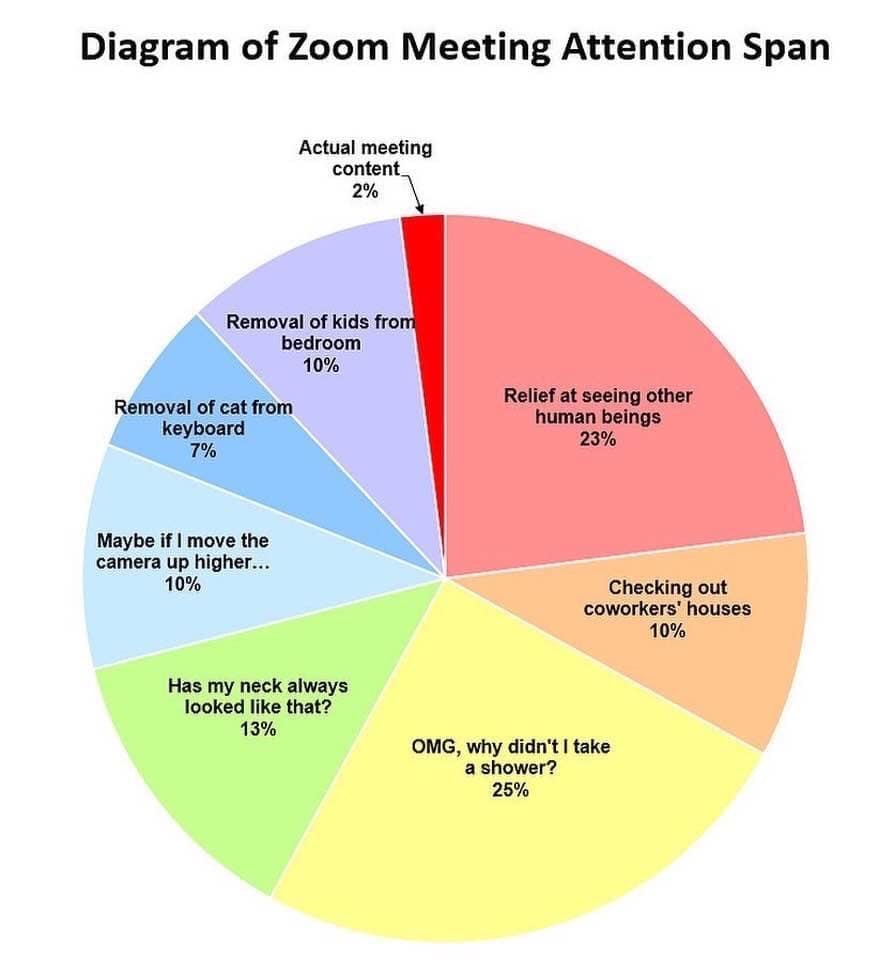
Note. A circle diagram and a humorous depiction of someone’s Zoom attention span in which we all, at least partly, can recognize ourselves. (Image Source: Rich Kaplowitz, 2020; Posted on Facebook March 27, 2020)
Critical Mathematics Conversation
When workplaces, universities, and schools closed down and people worked from home whenever possible, the numbers of Zoom meetings increased exponentially and became our virtual reality. This was also true for the number of images on Facebook about Zoom meetings. We found images about how to Zoom-dress, preferred Zoom backgrounds and favoured Zoom hair styles. We found humorous images about the impact Zoom meetings have on conversations, appearances, and actions. The image we chose (Figure 4) is a circle diagram sharing someone’s Zoom attention span in which we all, at least partly, can recognize ourselves—and smile at.
Mathematically, the image (Figure 4) reflects an accurate portrayal of circle graphs, which must add up to 100% (for a total of 360 degrees). However, for the individual pieces to add to 100%, it means that the options shown form the complete set of possible options (since one cannot go beyond the “whole Zoom experience” of 100%). In other words, these eight areas of focus for one’s attention span can be the only possible areas for recognition—or not.
A recognition of our societal behaviours and/or social discourses in the wider context, as well as us as individuals and our actions and relations “today,” is easy to joke about. The area referred to as “actual meeting content” occupies only 2% of one’s attention span (the joke), and catches the reader’s attention as they begin to think about what else they might be attending to (in their own world) with the remaining 98% that is not devoted to the meeting content. In fact, we suggest that this is precisely what teachers could ask their students to think about during and after a mathematics class taught remotely using Zoom. Students could be asked to construct a personal circle graph, with its unique attention span pieces, to illustrate what they have been paying attention to during the Zoom mathematics class (and we expect teachers would hope that the mathematics content gets allocated more than 2% of the circle!).
Cat-Math Images
Figure 5
Humorous Cat-Math Image About Self-Isolation
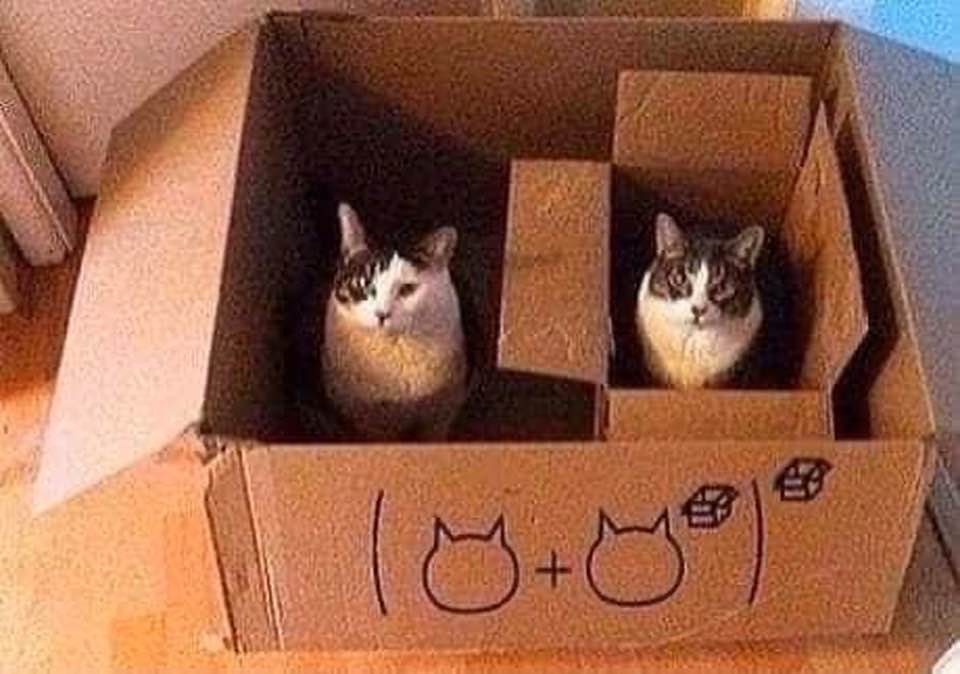
Note. This humorous cat-math image presents an interesting opportunity for understanding exponential functions in the form of f(x) = ax. (Image Source: Math/Science Jokes & Puns (or GTFO!), 2020; Posted on Facebook March 28, 2020)
Critical Mathematics Conversation
The connection of this image (Figure 5) to COVID-19 is with regard to the discourse of self-isolation and, in this humorous illustration, even the cats must isolate from one another. This image presents an interesting opportunity for understanding exponential functions in the form of f(x) = ax; in this case, the expression on the side of the box, translated into a more typical mathematical form, would be f(x) = (a + ax)x, where a=cat and x=box. The connection and metaphor extend even further by connecting the COVID-19 public discourse of isolation to the mathematical discourse of isolating variables when solving equations (when embedded/nested operations are involved). In fact, to correctly solve an exponential equation such as the one depicted here (f(x) = (a + ax)x), the problem solver must understand the required isolation and application of the small box cat exponent prior to applying the external exponent to the total contents of the big box. We believe this image and metaphor could serve as an appropriate medium to shape the mathematical (and pandemic) messages being conveyed with respect to exponents and isolation. However, in reference to Barwell and Abtahi’s (2019) question of how “consumers” of this image may interpret (or are expected to interpret) these discourses, the Facebook “consumer” of this image is probably expected to take the image at face value, and interpret it only as a clever way to bring cats into the equation on isolation.
We can analyse this image (Figure 5) by drawing on the work of Andersson and Wagner (2017) and ask why the authors chose NOT to use numbers in their representation. We suggest that an intentional lack of numbers actually functions here to portray the “softer,” more qualitative side of mathematics. Overall, the image was likely posted to lighten the mood of readers while, elsewhere in the news, those same readers were being bombarded with the reality of the pandemic’s exponential spread. At the very least, the image grabs one’s attention and serves to nurture a public’s infatuation with cats.
Figure 6
“Cattening the Curve”
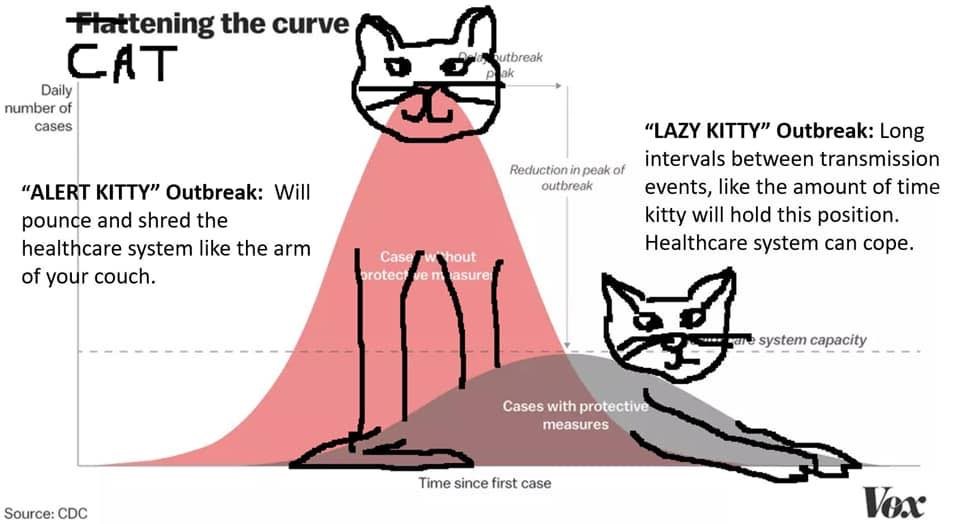
Note. This figure illustrates the positive effects on the health care system when the curve is flattened. (Image Source: Darling, 2020; Posted on Facebook March 28, 2020)
Critical Mathematics Conversation
This second cat-math image (Figure 6) provides immediate insight into the meaning of “flattening the curve” which, until the pandemic, was not a common expression within public discourse. We claim also that the language and graphical representation of exponential growth (and decay) were not, until recently, present within public discourse—a reality also displayed through our introductory image (see Figure 1). As in the previous critical mathematics conversation, this image also demands attention to, and nurtures, cat infatuation, though we believe this image serves as much more than a post to lighten the mood and disposition of the reader.
Analysing this graph through the lens of number (Andersson & Wagner, 2019), and posing the question of where are (not) the numbers, it becomes apparent that numbers are, in fact, conveniently absent. The axes are labelled with descriptors suggesting a scale and associated units (units of time for the horizontal axis and # cases/day for the vertical axis), but actual numbers are not included. We believe this was intentional since, if the scale and units had been provided, it would become clear that these two variables do not have a relationship yielding curves of these shapes. Thus, numbers are intentionally absent and not expected to be part of the discourse around this image.
Conversely, the graph does achieve (without the use of number) the intended aim of illustrating the positive effects on the health care system when the curve is flattened (or, cattened, as the image jokes). It does this through the humorous metaphor of a cat being alert/pouncing (peak reached so quickly that the system cannot cope) or lazy/slow (long intervals between infections such that system can adequately respond). The mathematics can be analysed in relation to, for example, bell curve distributions, slopes of tangents, and so forth.
Referring to the framework question which asks why the authors would have made the choice to use this representation (a graph), but to exclude numbers (Andersson & Wagner, 2019), we suggest that the absence of numbers serves to detract from the mathematical seriousness of the graph, suggesting that the graph can only be “talked about,” not taken to the level of calculations and precision. In other words, the image communicates a sort of “mathematics light” where there is an air of something vaguely mathematical, but it cannot be pinned down to fit into the public/media discourse—one that tends to construct “mathematics education in terms of a simple binary distinction between ‘traditional’ teaching and learning versus ‘discovery learning’” (Abtahi & Barwell, 2019, p. 50). In the absence of a traditional (back-to-basics) set of procedures to follow or a collection of mathematical concepts to be discovered through deeper devotion to the problem, “mathematics light” draws intrigue, in an otherwise mathematically/scientifically “heavy” time of pandemic.
Figure 7
A Map of the Main Known Genetic Variants of the SARS-CoV-2 Virus
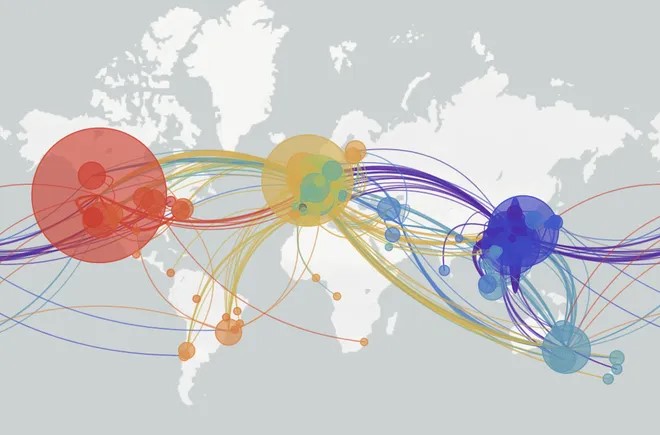
Note. This image is a snapshot in time from an interactive (and animated) map designed to show the transmission of the novel coronavirus (Image Source: Weise, 2020, Posted on Facebook March 30, 2020)
Critical Mathematics Conversation
A news story appearing in USA Today presented this image (Figure 7) of a map, with the caption: “A map of the main known genetic variants of the SARS-CoV-2 virus that causes COVID-19 disease.” This image is a snapshot in time (March 27, 2020) from an interactive (and animated) map designed to show the transmission of the novel coronavirus (https://nextstrain.org/ncov/global?animate=2019-12-08,2020-05-19,0,0,30000). Traced back to its animation starting point, the map reveals the origin of coronavirus as one small purple dot in central China in December 2019, with the animation then tracing its spread through to present day. The animation reveals how, gradually, the coronavirus tentacles reached out to other countries—France, Thailand, United States, Malaysia, and so forth.
With far-reaching tentacles extending toward nearest neighbours, the mathematics being depicted in this map (Figure 7) is a perfect example of how the field of graph theory relates to our real lives, even in surreal times. In the “real world” of graph theory, one can generalize any population or organization by arranging individuals on a graph composed of vertices (also called nodes) and edges (connections between vertices), where each vertex represents an individual and an edge between vertices denotes a relationship between those individuals. The edge can be drawn using a single or double arrow (directed graph) or merely a line (undirected graph). A particularly interesting dimension of graph theory that can be brought into the study of network graphs is the weighting of edges, meaning that a particular edge can carry more significance or value (which could also be interpreted as privilege or power) than others in the network graph. Additional interesting possibilities for analyses exist: one can refer to nearest neighbour (adjacent vertices), the degree of a vertex (the number of edges connecting a vertex/node to any other), articulation points (where a vertex has been cut off), and so forth. We could (but won’t) continue to write more about this fascinating field of mathematical study (see, for example, Clark & Holton, 1991, for pure mathematics and Scott, 2013, for mathematical applications to social science networks).
Analysing this image through the lenses of critical mathematics, we draw on Skovsmose’ (1994) question of how this image can serve as a tool for identifying and analysing critical features of society, especially globally, and in what ways the mathematics of this image might serve to reproduce inequalities. We note that the image (Figure 7) is presented as an undirected graph, though we are fully aware—through viewing the animation and through our own reading of stories in the media—that this is not the case. In fact, escalating tensions and finger-pointing have emerged in the media, with people determined to establish who “started it all.” We also work into our analysis an understanding that air travel was the enabler in initiating the pandemic spread, which alone highlights inequities between the global North and South. In the language of graph theory, where a vertex represents a country and each edge the pathway of air travel, one immediately surmises that some edges likely carry more weight than others. One might suggest that this highly networked graph is what prompted the urgent, and repeated, pleas of “stay home”; yet, at the same time, “stay home” for those in crowded conditions of refugee camps and other poverty-stricken settlements is actually counter to the message of maintaining required physical distancing, and hence safety. With COVID-19 spreading rapidly, countries (vertices) in the global North grounded air travel (that is, they essentially cut their connections with their nearest neighbours, producing many articulation points in the graph), whereas those in the global South were left struggling to reduce the weight of other inequities.
A framework question from Andersson and Wagner (2017) directs our attention to how this image (Figure 7) serves as a powerful means of having students reflect on the effects of using representations which do not rely on the use of number to make their argument. In graph theory, representations like this one—whether one points to it in the analysis of COVID-19 spread or constructs a different weighted graph to study, for example, relationships between friends on Facebook (Hulgan, 2019)—we find ourselves drawn to quoting mathematical biologist Martin Nowak, who studies networks in the context of cooperation: “More connectivity won’t necessarily promote people being good to each other. It’s not that global connections are bad, but they are no substitute for a small number of strong local connections” (Nowak, as cited in Highfield, 2017).
Figure 8
Geo-Fun While Staying Home
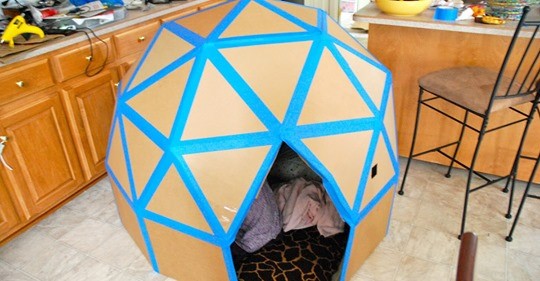
(Image Source: Smart School House, n.d.; Posted on Facebook March 30, 2020)
Critical Mathematics Conversation
With the rapid spread of COVID 19 and the advice offered to protect ourselves from becoming infected, this image (Figure 8) draws the reader into some “geo-fun” while staying home, and staying safe. The mathematics of geodesic domes is generally part of Grades 8–10 school mathematics curricula,[2] where Platonic solids are studied and constructed. Reflecting back, however, on our own experiences of learning related topics in Grades 8–10, we recall how the act of achieving a geometry outcome—such as determining Euler’s formula for convex polyhedral—was seldom accompanied by an opportunity to build, play and crawl into these three-dimensional solids. Even though teachers might readily admit that a two-dimensional textbook image and formula could never adequately (re)present the richness of geometric solids, many, unfortunately, become stuck in the textbook paradigm and associated time constraint discourses (Nolan, 2012). Ironically then, the authentic experience of constructing a platonic solid is portrayed here (Figure 8) as suitable only for the time one has available in an out-of-school (home schooling) environment during a pandemic.
Drawing on a critical question posed by Andersson and Wagner (2017) to prompt reflections on number, this activity does, in fact, highlight what is possible when numbers are not used (at least when they are not a primary focus). This image (Figure 8) draws on a form of representation that prompts the reader to see and experience mathematical creativity. The image is drawn from a website promoted as “crafts for kids” (https://www.instructables.com/id/Cardboard-Geodesic-Dome/) and the plans available on that website for building the geodesic dome highlight only the language of triangles and pentagons. By following a short trail of links, however, one comes across websites which include rich mathematical language and history of symmetry, polyhedron/a, the five Platonic solids, spherical trigonometry and even the fascinating work of Michael Goldberg.[3] Regrettably, some of the authors of these sites rich in mathematics apologize for taking the reader so deeply into “the boring theory side of things.”
For our CME analysis, we look to Barwell and Abtahi’s (2019) question about how discourses can construct mathematics education, educators and students. From this image (Figure 8) and associated websites, it is apparent that, in building a geodesic dome, the complicated mathematics is best left “behind the scenes” for those who are smart enough to digest it (i.e., “for the smartest of citizens”) (Nasir et al. 2008, p. 226). For the rest of us, we will (hopefully) prevail by following a series of steps or procedures using a ruler, scissors, and some basic knowledge of triangles and pentagons. Returning to our CME framework, we also draw on a question framed by Nasir et al. (2008) and ask: In what ways does the geodesic dome image reflect “out-of-school environments [which] hold quite different opportunities for [the reader] in terms of authentic problem solving, ongoing feedback, and meaningful relationships”? With regard to this image (Figure 8), the question may be a matter of whether authentic problem solving, even in “out-of-school environments,” is at risk of becoming “mathematics light” if the steps to construct (the dome or other geometric object) are executed without ongoing meaningful analysis (of angles, symmetry, relationships of faces/edges, etc).
Keeping the Distance(s)
Figure 9
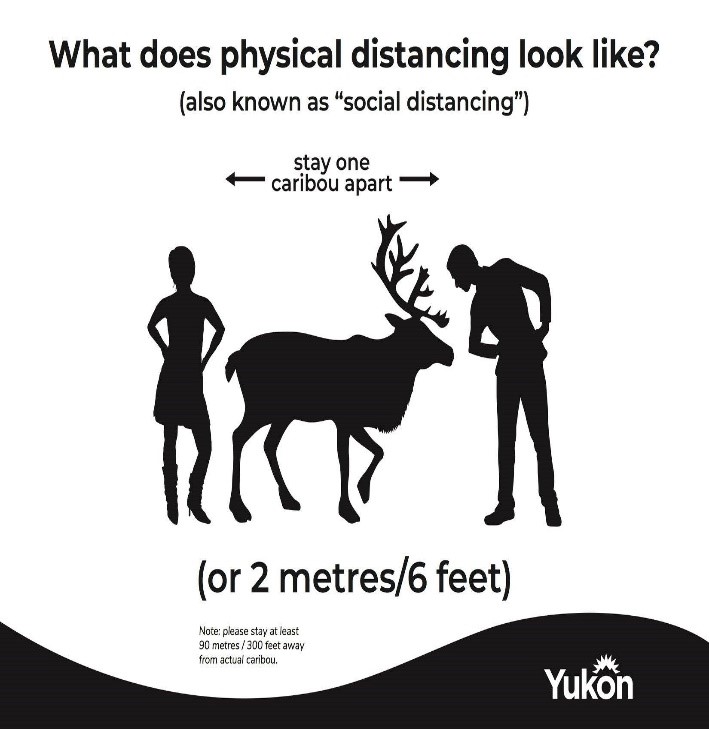
Illustration of What Physical Distancing Looks Like
(Source: David Suzuki Foundation, 2020; Posted on Facebook April 1, 2020)
Figure 10
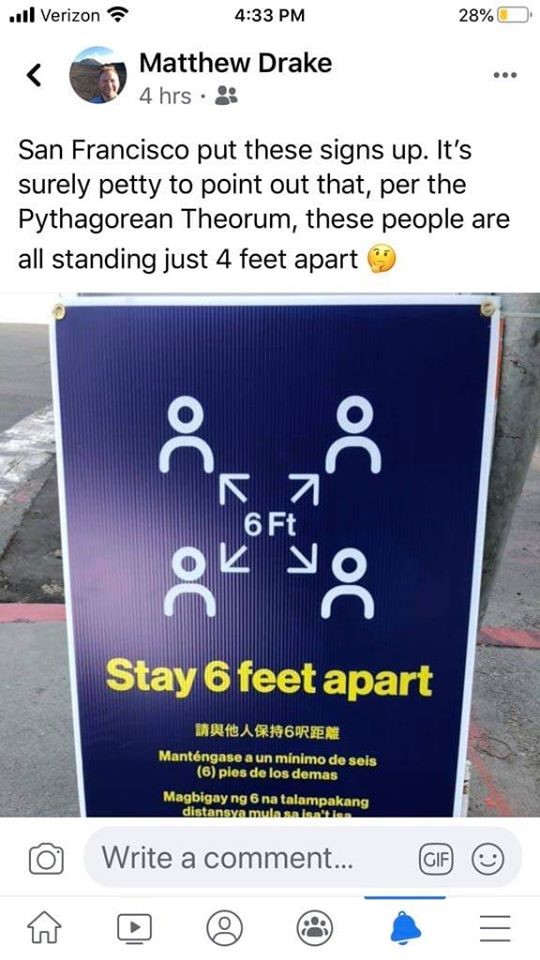
Pythagorean Theorem and Social Distancing Signs
Note. This figure is a good source for “real” critical mathematics conversations and an example of a practical use, both in and out of mathematics classrooms, of the Pythagorean theorem as a “learning landscape” with “real-life references” (Skovsmose, 2001a, p 124) (Image Source: Drake, n.d.; Reposted to Facebook).
Figure 11
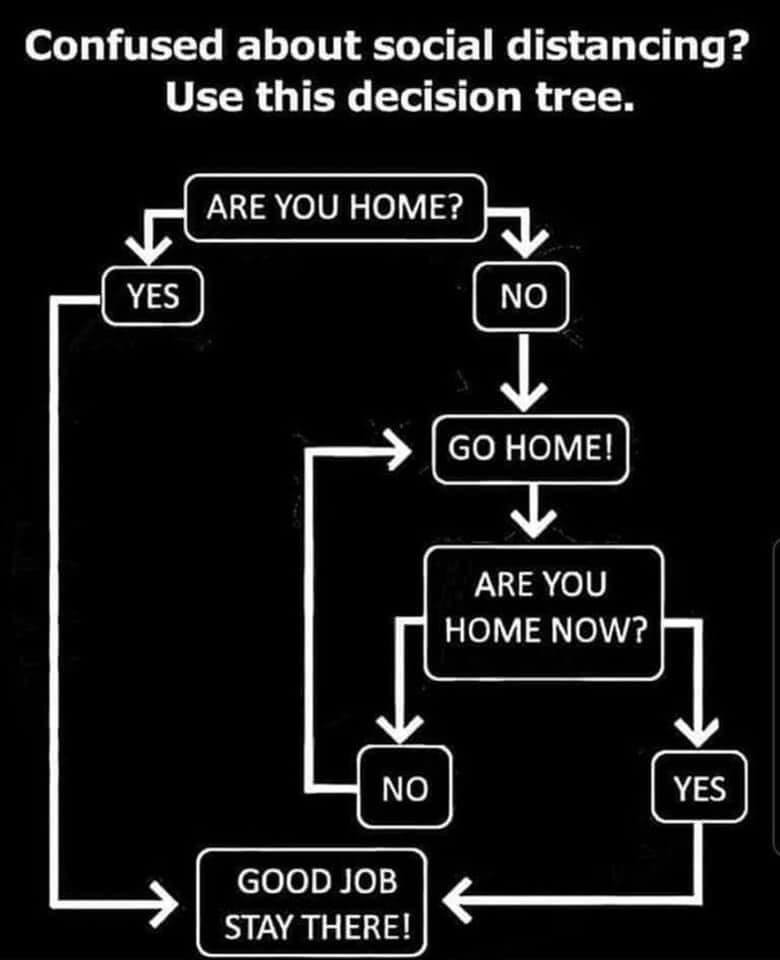
Decision Tree for Social Distancing
(Image Source: Downtown Markham, 2020; Posted on Facebook March 30, 2020)
Figure 12
Social Distancing Joke
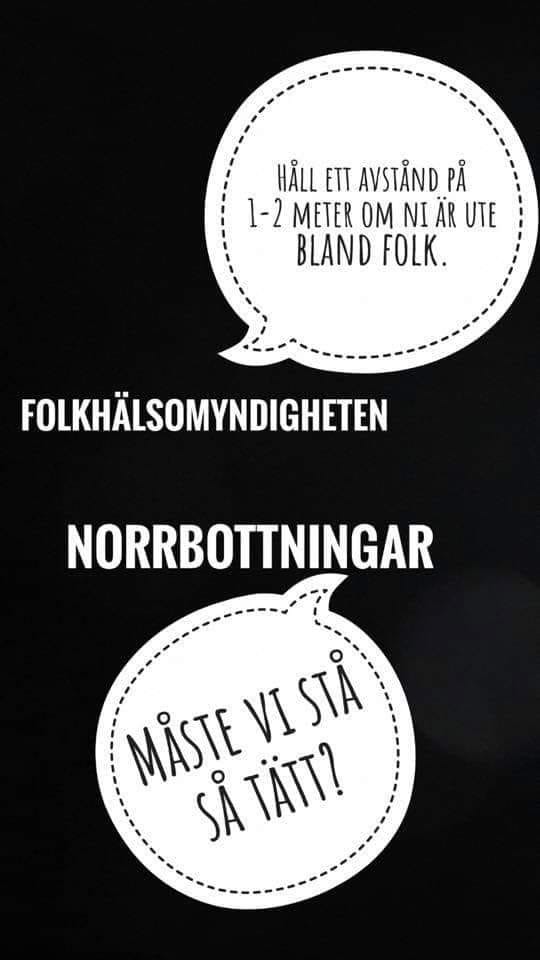
Note. Folkhälsomyndigheten [The Public Health Agency of Sweden]: “Keep a distance of 1–2 meters if you are out among people” Norrbottningar [People living in the furthest northern Swedish province Norrbotten]: “Do we have to stand that close?”[4] [Translated by Andersson] (Image Source: Citat, 2020; Posted on Facebook March 30, 2020)
Critical Mathematics Conversation
“Keeping the distance” was a very popular Facebook theme as a high number of our virtual friends perceived it as their role to share posts about keeping distances, with the overarching goal of stopping the virus spread. Initially, our Public Health Authorities labelled the distance as “social,” in both our languages (Swedish and English). However, the discourse changed and “social” soon became “physical” since the intention was, and still is, to keep an infection-preventative distance between people.
These images inspire ideas for CME teaching on concepts of distances in preschool and for children in the lower grades. The caribou image (Figure 9) teaches us that a physical distance should be two meters between people and 90 m between people and caribous; hence the image reflects, in a humorous way, an “out-of-school environment” that, in line with Nasir et al. (2008), offers opportunities for younger students to learn about (the differences between) social and physical distances. There are several ways to play with the required distances: with bodies; with or without manipulatives; using furniture; counting numbers of different animals that fit within these distances; with images; making handicrafts; and art. Hence, making the “virtual distance reality” a “real reality,” also for younger children.
Regarding the San Francisco signs (Figure 10), we will not comment further on the mathematics as the author commented critically himself. We believe, however, that the image would be a good source for “real” critical mathematics conversations and an example of a practical use, both in and out of mathematics classrooms, of the Pythagorean theorem as a “learning landscape” with “real-life references” (Skovsmose, 2001a, p 124).
In line with Barwell and Abtahi’s (2019) ideas, the black and white decision tree flowchart image (Figure 11) invites us to reflect on discourses about (school) mathematics as being taught as a logically and structured subject. Also, Mukhopadhyay and Greer (2001) offered:
Mathematics is commonly seen as consisting essentially of computation and formulas, yielding exact and infallible answers, without relevance to everyday life, accessible only by experts, and not open to criticism. Indeed, in many respects mathematics is commonly perceived as the antithesis of human activity—mechanical, detached, emotionless, value-free, and morally neutral. (p. 297)
This flowchart (Figure 11) nurtures assumptions and discourses about (school) mathematics. The exclamation marks underline this discourse, resembling instructions in mathematics textbooks as calculate (!), simplify (!), express (!). Consumers of these images will probably find the flowchart associating with, or confirming, discourses about mathematics being a subject where thoughts, answers, and actions are either right or wrong, logical or illogical, or “black or white”; that is, the flowchart is structured in a way that the only “right” place to end up is “at home” and to “stay there!”, which is the (only) right place, the (only) right answer to the problem—a problem constructed by someone we do not know, about a virus spread we do not (yet) understand, in a seemingly “un-logical” “un-predictable” and “un-real” world, and all taking place in a “surreal” time where seemingly only mathematics can provide us with correct answers.
The joke image (Figure 12) in Swedish urges us to reflect on cultural jokes in mathematics education (because jokes are situated in cultural meanings) and “what we find humorous … [is] not easily disentangled from the society and culture in which we ourselves are embedded, nor from the minority groups to which we may belong” (LaFollette & Shanks, 1993, p. 136–137) and consequently might reproduce inequalities (Skovsmose, 1994). The humour in this cultural image, however, may inspire a change from the usual media discourses (Barwell & Abtahi, 2019) about mathematics education. That is, the mathematics itself could inspire the cultural meaning of a joke, as in the definition of mathematical humour offered by Tap et al. (2019): “Humour derived from the mathematics concepts being discussed, combined with general humour ideas, particularly the incongruity theory of humour characterised by elements of surprise and unexpected twists or turns” (p. 246). In this case, we argue that jokes and humour—with a high level of recognition for the individuals but without pinpointing certain groups of people or human characteristics—might make mathematics classrooms a happier and joyful “real” place to be.
Figure 13
A View From an Indian Doctor on Social Distancing
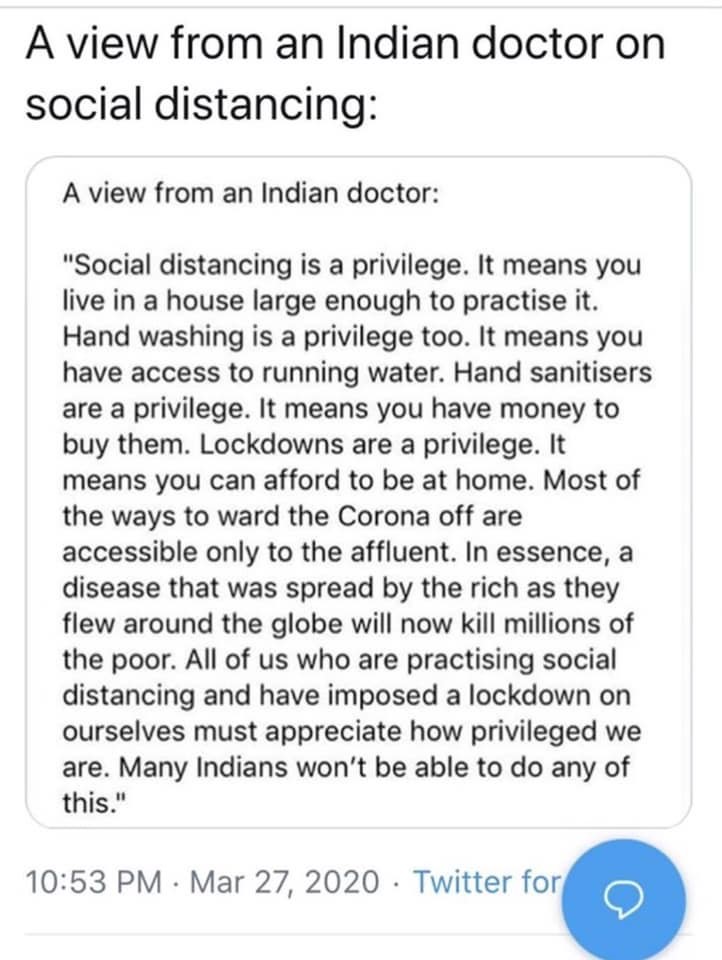
Note. The focused and short text highlights the fact that it is a privilege to be one of those who are able to impose a lockdown on oneself. (Image Source: Perkins, 2020; Posted on Facebook March 27, 2020)
Critical Mathematics Conversation
Our last image (Figure 13), originally a tweet that was re-posted on Facebook, is different from all of the other images we discussed since the image is entirely text. Authored by an anonymous Indian doctor, the message conveys what a lockdown might mean in different parts of the world, of a country, or of a city. The focused and short text highlights the fact that it is a privilege to be one of those who are able to impose a lockdown on oneself. We see this text as a rich source for CME and/or interdisciplinary teaching since the text may be considered as an ethically rich text (Andersson & Wagner, 2017). There are no obvious numbers, although we identify a high number of hidden numbers: What is a “large enough house”? Who, or how many people, have (not) access to running water or wash rooms? Can people in your country/city /neighbourhood afford a lockdown? and so forth.
Although this image (Figure 13) originates in an Indian context, we note that the caste system is not mentioned, despite the fact that the caste system “plays a significant role in determining access to mathematics education” (Subramanian, 2017, p. 925) and to who lives in poverty (Thorat & Newman, 2007), which is the theme that permeates the image text. We ask if this may be a hidden (mathematical) discourse and propose that interdisciplinary teachings together with CME could further explore the impact the caste system might have, based on the conclusions made by the Indian doctor about the effects of the pandemic on people living with different circumstances, but also the impact on children’s access to schools and education due to caste, social class, gender, privileges, age and/or other social categories in India and elsewhere. Drawing on Nasir et al. (2008), ethical questions may be asked in mathematics classrooms about the image’s potential to actually problematize “Eurocentric assumptions about valid mathematics.” Hence, if the mathematics used to impose a lockdown had taken other aspects into account—such as the impact a lockdown may have on people living in poverty (as the image, Figure 13, indicates), but also, for example, increasing mental health issues, youth becoming excluded from their daily activities and schools, increased domestic violence—what would the advice have looked like then? Who would have benefitted…?
Discussion
“Our situation on this earth seems strange. Every one of us appears here, involuntarily and uninvited, for a short stay, without knowing the why and the wherefore.”(Einstein, 1932, as cited in Morreall, 2014, p. 130)
According to Morreall (2014), who cites Einstein’s words above, “We need to be ready for surprises …, and so need to cultivate mental flexibility so that we are versatile” (p. 130). The mental flexibility and versatility written about by Morreall is in relation to humour and, as we write this article during these pandemic times, humour has supported our work through and through while dealing with the serious matters that are attached to the conversations we raised or suggested above. We have appreciated the “humour derived from the mathematics concepts being discussed, combined with general humour ideas, particularly the incongruity theory of humour characterised by elements of surprise and unexpected twists or turns” (Tap et al., 2019, p. 246). When analysing and writing up our analyses, we have used humour to critically reflect on mathematics per se, on mathematical, educational, and societal discourses and on some issues associated with the COVID-19 pandemic as it continues to unfold, both in our real and virtual lives at this surreal point in time, a surreal that has become, during this past year, the new normal.
In closing this paper, we feel the urge to reflect on our own privileged positions and contexts. Writing this article means that we had access to computers, a library, Internet and Zoom. We could afford a lockdown. We live in the global North, with the power and privileges that come with our own “real” lives. Our Facebook walls mirrored these privileges associated with our contexts (even in lockdown) and are clearly visible in our text. Our work confirms Skovsmose’s (1994) argument that “mathematics has an important social influence; it follows that to understand this formatting power becomes an essential aspect of critical mathematics education” (p. 207).
We view this paper as an inspiration for mathematics teachers and teacher educators, not only at this time of writing in a world of remote teaching, but well beyond due to how it has modelled a process for analysing and understanding the real and virtual world of mathematics. Our analysis questions focus on identifying the mathematics topic being depicted through Facebook images and how the images might serve as artefacts of CME. Given that the images range from exponential graphs of infection rates and pie charts of online attention spans to cat-math and geodesic domes, we suggest that teachers consider beginning with the virtual (mathematical world) and the surreal (what is often coined “the new normal”) as a way of disrupting the real (mathematics classrooms).[5]
Andersson and Wagner (2017) argued that “people use mathematics to manipulate and control others. However, it is possible to use mathematics to counter such manipulations and to rectify injustices that are partially attributable to these manipulations” (p. 26). We wish and hope that mathematics teachers and teacher educators become inspired to continue their important work and to move critical mathematics education forward in their own contexts with the goal of educating critically aware students who have power to question the mathematics that influences and formats their lives. As Skovsmose (2007) offered, “If the citizens were not able to read information put into numbers, the society would not be able to operate” (p. 14). If one possible way to (teach students to) question the mathematics that formats our lives can be through an endeavour to critically and mathematically analyse the virtual in a surreal real-world, in mathematics education classrooms, on all levels—then we say go for it (!).
References
Abtahi, Y., & Barwell, R. (2019). Mathematical morality tales: Mathematics education in Canadian newspapers. Canadian Journal of Science, Mathematics, and Technology Education, 19, 48–60. https://doi.org/10.1007/s42330-019-00042-0
Andersson, A. (2011). A “curling teacher” in mathematics education: Teacher identities and pedagogy development. Mathematics Education Research Journal, 23(4), 437–454. http://doi: 10.1007/s13394-011-0025-0
Andersson, A., Meaney, T., & Valero, P. (2015). “I am [not always] a math-hater”: Students’ (dis)engagement in mathematics education. Educational Studies in Mathematics, 90(2), 143–161. http://doi:10.1007/s10649-015-9617-z
Andersson, A., & Ravn, O. (2012). A critical perspective on contextualisation in mathematics education. In O. Skovsmose & B. Greer (Eds.), Opening the cage: Critique and politics of mathematics education (pp. 309–324). Sense Publishers.
Andersson, A., & Wagner, D. (2017). Numbers for truth and reconciliation: Mathematical choices in ethically rich texts. Journal of Mathematics and Culture, 11(3), 18–35.
Barwell, R., & Abtahi, Y. (2019). Mathematics education in the news: Introduction. Canadian Journal of Science, Mathematics, and Technology Education, 19, 1–7. https://doi.org/10.1007/s42330-019-00043-z
Benoit, G. (2018). Mathematics in popular culture: An analysis of mathematical Internet memes [Unpublished doctoral dissertation]. Teachers College, Columbia University
Casey, G. (2013). Interdisciplinary literacy through social media in the mathematics classroom: An action research study. Journal of Adolescent & Adult Literacy, 57(1), 60–71. https://doi.org/10.1002/jaal.216
Chen, G. (2017). Should public schools use Facebook? Pros and cons. Public School Review. https://www.publicschoolreview.com/blog/should-public-schools-use-facebook-pros-and-cons.
Citat, R. (2020). Facebook. https://www.facebook.com/Roliga.Citat/photos/pb.446679365537573.-2207520000../1223482671190568/?type=3&eid=ARDhJFwCSG_nTQ3FDRRs8q2juUqRjw_Y88iYNtVodUob3_S-MfPjHhz8pb9CAzKH7Fu3KTrn26_cv_zT
Clark, J., & Holton, D. (1991). A first look at graph theory. World Scientific.
Darling, A. M. (2020, March 28). #Catteningthecurve. Twitter. https://twitter.com/amdar1ing/status/1237880129575157760
David Suzuki Foundation. (2020, April 1). Facebook. https://www.facebook.com/DavidSuzukiFoundation/photos/10158264596108874
Downtown Markham (2020, March 30). Twitter. https://twitter.com/downtownmarkham/status/1244650902558068737
Funtowicz, S. O., & Ravetz, J. R. (1993). Science for the post-normal age. Futures, 25(7), 739–755. https://doi.org/10.1016/0016-3287(93)90022-L
Global News Canada. (2020, March 26, Posted on Facebook March 26, 2020). Coronavirus Tracker. https://globalnews.ca/news/6649164/canada-coronavirus-cases/?utm_medium=Facebook&utm_source=GlobalNews&fbclid=IwAR1_daVmwHAPb8rJUECR4xdQSYDp5LT6-Cjvds2XOAYkeYwxXABsKDNXQ3M
Gutstein, E. (2006). Reading and writing the world with mathematics: Toward a pedagogy for social justice. Taylor & Francis.
Hauge, K. H., & Barwell, R. (2021, forthcoming). A critical mathematics education for climate change: A post-normal approach. In A. Andersson & R. Barwell (Eds.), Applying critical perspectives in mathematics education. Brill Sense Publishers.
Hidayatullah, A., & Suprapti, E. (2020). The affect of the Internet and social media: Mathematics learning environment context. IOP Conference. Series: Earth and Environmental Science, 469: 012080. IOP Publishing. https://doi.org/10.1088/1755-1315/469/1/012080
Highfield, R. (2017). Mathematics reveals difference between Facebook friends and real friends (March 31, 2017). Science Museum (Blog), London, UK. Retrieved April 20, 2020: https://blog.sciencemuseum.org.uk/mathematics-reveals-difference-between-facebook-friends-and-real-friends.
Hulgan, J. (2019, April 25). Why Facebook belongs in the math classroom. The Conversation: Academic Rigour, Journalistic Flair http://theconversation.com/why-facebook-belongs-in-the-math-classroom-112740
Jurdak, M. (2006). Contrasting perspectives and performance of high school students on problem solving in real world situated, and school contexts. Educational Studies in Mathematics, 63(3), 283-301. https://www.jstor.org/stable/25472131
LaFollette, H., & Shanks, N. (1993). Belief and the basis of humor. American Philosophical Quarterly, 30(4), 329–339. https://www.jstor.org/stable/20014471
le Roux, K. (2008). A critical discourse analysis of a real-world problem in mathematics: Looking for signs of change. Language and Education, 22(5), 307–326.
le Roux, K. (2019). An Africa-centred knowledges approach to theory use in research about mathematics education and society. In J. Subramanian, (Ed.), Proceedings of the Tenth International Mathematics Education and Society Conference. Hyderabad, India: MES10.
Liljedahl, P., Santos-Trigo, M., Malaspina, U., & Bruder, R. (2016). Problem solving in mathematics education. In Problem Solving in Mathematics Education (pp. 1–39). Springer, Cham.
Lunney Borden, L. (2021, forthcoming). Decolonising mathematics education in a time of reconciliation. In A. Andersson & R. Barwell (Eds.), Applying critical perspectives in mathematics education. Brill Sense Publishers.
Math/Science Jokes & Puns (or GTFO!) Facebook Group. (2020, March 28). Facebook. https://www.facebook.com/groups/323670214775503/media
Morreall, J. (2014). Humor, philosophy and education. Educational Philosophy and Theory, 46(2), 120–131. https://doi.org/10.1080/00131857.2012.721735
Mukhopadhyay, S., & Greer, B. (2001). Modelling with purpose: Mathematics as a critical tool. In B. Atweh, H. Forgasz, & B. Nebres (Eds.), Socio-cultural aspects in mathematics education (pp. 295–311). Lawrence Erlbaum.
Nasir, N. S., Hand, V., & Taylor, E. (2008). Culture and mathematics in school: Boundaries between "cultural" and "domain" knowledge in the mathematics classroom and beyond. Review of Research in Education, 32(1), 187–240. https://doi.org/10.3102/0091732X07308962
Nolan, K. (2012). Dispositions in the field: Viewing mathematics teacher education field experiences through the lens of Bourdieu’s social field theory. Educational Studies in Mathematics, 80 (1/2), 201–215. https://www.jstor.org/stable/41485976
Noyes, D. (2020). The top 20 valuable Facebook statistics—updated May 2020. Zephoria Digital Marketing. Sarasota, FL: Zephoria Inc. Retrieved May 5, 2020 from https://zephoria.com/top-15-valuable-facebook-statistics/
Perkins, M. (2020, March 27). Twitter. https://twitter.com/perkinsmiki/status/1243811658239078400
Quinn, A. (2018). Social media mathematics. The Mathematics Teacher, 111(5), 390–397. https://doi.org/10.5951/mathteacher.111.5.0390
Rich Kaplowitz, D. (2020, March 27). Facebook. https://www.facebook.com/donna.kaplowitz/posts/10156572600326534
Scott, J. (2013). Social network analysis (3rd ed.). SAGE.
Skovsmose, O. (1994). Towards a philosophy of critical mathematics education. Kluwer.
Skovsmose, O. (2000). Aporism and critical mathematics education. For the Learning of Mathematics, 20(1), 2–8. https://www.jstor.org/stable/40248312
Skovsmose, O. (2001a). Landscapes of investigation. Zentralblatt für Didaktik der Mathematik, 33(4), 123–132. https://doi.org/10.1007/BF02652747
Skovsmose, O. (2001b). Mathematics in action: A challenge for social theorising. In E. Simmt, & B. Davis (Eds.) Proceedings of the 2001 annual meeting of the Canadian Mathematics Education Study Group (pp. 3–17). Edmonton, AB, Canada.
Skovsmose, O. (2007). Mathematical literacy and globalisation. In B. Atweh, A. C. Barton, M. C. Borba, N. Gough, C. Keitel, C. Vistro-Yu, & R. Vithal (Eds.), Internationalisation and globalisation in mathematics and science education (pp. 3–18). Springer. https://doi.org/10.1007/978-1-4020-5908-7_1
Skovsmose, O. (2014). Critique as uncertainty. Information Age Publishing.
Smart School House, (n.d. Posted to Facebook March 30, 2020) Amazing ideas for kids to try. https://www.smartschoolhouse.com/diy-crafts/ideas-for-kids
Steffensen, L., Herheim, R., & Rangnes, T. E. (2018). Wicked problems in school mathematics. In E. Bergqvist, M. Österholm, C. Granberg, & L. Sumpter (Eds.), Proceedings of the 42nd Conference of the International Group for the Psychology of Mathematics Education (Vol. 4, pp. 227–234). Umeå, Sweden: PME.
Subramanian, J. (2017). Beyond poverty and development: caste dynamics and access to mathematics education in India. In A. Chronaki, (Ed.), Proceedings of the Ninth International Mathematics Education and Society Conference, vol. 2, pp. 924–935.
Tap, W.D., Mtetwa. D. K., & Vere, J. C. (2019). Using humour for generating and maintaining interest in mathematics among secondary school students in South Sudan re-settled communities. African Journal of Research in Mathematics, Science and Technology Education, 23(2), 244–253. https://doi.org/10.1080/18117295.2019.1656871
Thorat, S., & Newman, K. S. (2007). Caste and economic discrimination: Causes, consequences and remedies. Economic and Political Weekly, 42(41), 4121–4124.
Tripathi, S. (2020, March 27). Twitter. https://twitter.com/saliltripathi/status/1243598490808303621
Truth and Reconciliation Commission (TRC) of Canada (2015). Truth and Reconciliation Commission of Canada: Calls to Action. TRC of Canada.
Valero, P. (2004). Socio-political perspectives on mathematics education. In P. Valero, & R. Zevenbergen (eds.), Researching the Socio-Political Dimensions of Mathematics education (pp. 5–23). Springer. https://doi.org/10.1007/1-4020-7914-1_2
Verschaffel, L., Greer, B., & De Corte, E. (2000). Making sense of word problems (pp. XVII–X203). Swets & Zeitlinger.
Weise, E. (2020, March 27, Posted to Facebook March 30, 2020). 8 strains of the coronavirus are circling the globe. Here's what clues they're giving scientists. USA Today. https://www.usatoday.com/story/news/nation/2020/03/27/scientists-track-coronavirus-strains-mutation/5080571002/
Wolfson, E., & Wilson, C. (2020, March 26/updated 2020, July 29. Posted on Facebook March 26, 2020). Is the U.S. 'Flattening the Curve?' Check Our Coronavirus Chart for Daily Updates. Time. https://time.com/5809038/coronavirus-flatten-curve/
[1] This speech took place on March 11 2020; see https://www.who.int/dg/speeches/detail/who-director-general-s-opening-remarks-at-the-media-briefing-on-covid-19---11-march-2020
[2] For example, in the province of Ontario in Canada, a Grade 8 mathematics curriculum outcome is as follows: Determine, through investigation using concrete materials, the relationship between the numbers of faces, edges, and vertices of a polyhedron (i.e., number of faces + number of vertices =number of edges + 2) (Sample problem: Use Polydrons and/or paper nets to construct the five Platonic solids [i.e., tetrahedron, cube, octahedron, dodecahedron, icosahedron], and compare the sum of the numbers of faces and vertices to the number of edges for each solid.). Available: https://ca.ixl.com/standards/ontario/math/grade-8
[3] 20th century mathematician Michael Goldberg is credited with describing a set of new shapes, which have been named after him, as Goldberg polyhedral. An interesting historical anecdote has it that geometers do not consider Goldberg’s shapes as polyhedral because they do not have planar faces (https://theconversation.com/after-400-years-mathematicians-find-a-new-class-of-solid-shapes-23217).
[4] We add that it was not only Norrbottningar we found jokes about, but also, we noted a number of images of, for example, Finnish people, people from the Northern Canadian provinces, and urban people in bus lines, with the same kind of joke.
[5] In the year that has passed since these images were collected for this paper, the pandemic has remained an enduring reality worldwide—remote and/or hybrid teaching persists in most educational contexts; Zoom, Webex, and other online video conferencing platforms have not only become the norm for facilitating work meetings but also for most family and community gatherings. We are thus, at this time, compelled to acknowledge, embrace even, the fading of the distinctions made between real, virtual and surreal in our discussions, since they commingle and intersect in ways that we never thought possible just one year ago. We, along with other educators/researchers, have had to acknowledge and accept how, these days, digital life is “real life” and what is surreal is very much redefined every day.